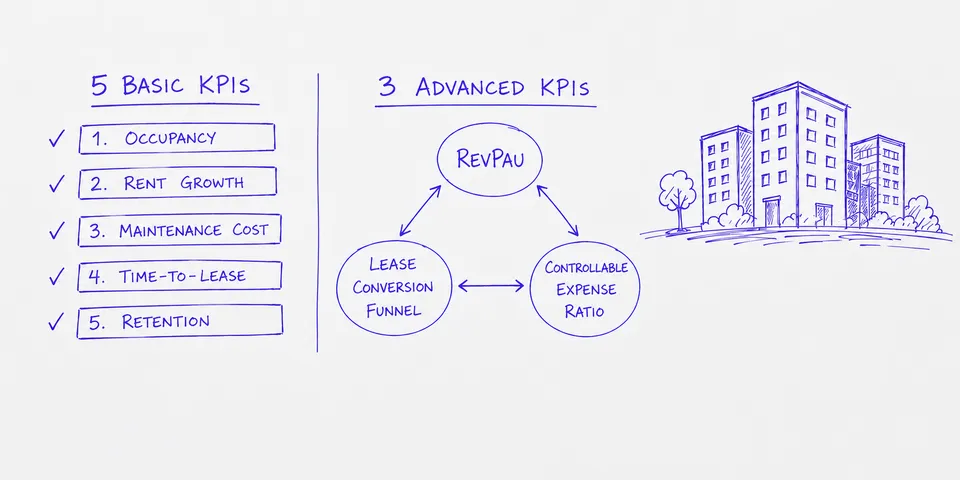
Property Management KPIs That Actually Drive Decisions
Every multifamily operator has a dashboard. Most of them show the same five numbers: occupancy, rent, collections, work orders, and turnover. These are table stakes. You need them, but they are not what separates a top-quartile portfolio from an average one.
The difference comes down to three property management KPIs that most operators cannot track accurately — not because they do not know about them, but because their data infrastructure does not support them. The property management system (PMS) was never designed to be an analytics platform. And when you are running three PMS platforms across a portfolio assembled through acquisitions, the gap between what you want to measure and what you can actually measure gets wide.
This post covers both sides. The five standard property management KPIs you should already be tracking, and the three that require a different approach to data before they become useful.
The Five KPIs Every Operator Tracks
These are not optional. If you are a VP of Operations reporting to a COO or a board, these numbers come up in every meeting. The question is not whether you track them — it is whether you trust them.
Occupancy Rate
Occupancy rate is the most visible metric in multifamily property management. It is calculated as total occupied units divided by total available units, expressed as a percentage.
Most operators track this at the portfolio level and break it down by property. That is necessary but not sufficient. The number that matters more is occupancy by unit type — one-beds versus two-beds versus three-beds — because it tells you where demand is shifting before portfolio-level occupancy moves.
Data source: PMS lease records, unit inventory.
The challenge runs deeper than system fragmentation. Your internal occupancy definition will often differ from what your PMS calculates out of the box. You might count a unit as occupied on lease execution, while your PMS counts it as occupied on move-in. You might exclude corporate housing or short-term leases from occupancy, while the PMS includes them. Reconciling these definitional differences across properties requires both standardized logic and consistent application at every site. If you run two PMS platforms, occupancy data lives in two systems with different unit-type taxonomies and different occupancy logic. Reconciling them manually in a spreadsheet works for a quarterly board deck. It does not work for weekly operating decisions.
Effective Rent Growth
Effective rent growth measures what tenants actually pay after concessions, free months, and lease incentives are factored in. It is distinct from asking rent and market rent.
Tracking effective rent growth versus market comps tells you whether your pricing strategy is working or whether you are buying occupancy with concessions. The number is useless in isolation. It needs to be compared against submarket benchmarks on a rolling basis.
Data source: PMS lease records (rent rolls, concession tracking), third-party market data from providers such as CoStar or Yardi Matrix.
This one breaks down fast when concessions are tracked inconsistently across properties. One regional manager enters a free month as a concession. Another adjusts the base rent. Your effective rent calculation is wrong before it reaches the dashboard.
Maintenance Cost Per Unit
Maintenance cost per unit is calculated as total maintenance spend divided by total units. Simple in concept. Hard to get right in practice.
The useful version of this metric is not the portfolio average. It is the property-level breakdown by maintenance category — appliance, plumbing, HVAC, common area — compared against property age and unit count. That breakdown tells you which properties are trending toward capital expenditure problems and which are operating efficiently.
Data source: PMS work order systems, accounts payable, vendor invoicing.
The problem: maintenance data is the messiest data in property management. Work orders live in the PMS. Vendor invoices live in the accounting system. Matching them requires a common identifier that often does not exist, especially when maintenance is handled by a mix of in-house staff and third-party vendors.
Time-to-Lease
Time-to-lease is the number of days from when a unit becomes available (move-out or notice-to-vacate) to a signed lease. Not move-in — signed lease.
Time-to-lease is a leading indicator for occupancy. If it is trending up, occupancy will drop in 30 to 60 days. If it is trending down, your leasing team and pricing strategy are working. Tracking it by property and by unit type gives you early signal on where to allocate marketing spend and where to adjust rents.
Data source: PMS lease records (notice dates, vacancy dates, application dates, lease execution dates).
This metric requires four date fields to calculate correctly. Most PMS platforms automatically capture notice-to-vacate dates and lease execution dates with accuracy because these trigger system workflows and compliance requirements. Application dates and lease execution dates flow reliably through the system as part of the lease workflow. The dates that break down are vacancy dates and lease execution dates that depend on whether the site team logs data consistently. One property that does not record when a unit physically became available or that leaves lease execution dates blank throws off the portfolio average. Worse, if different properties enter these dates at different points in their process — some on offer, some on application, some on actual execution — your portfolio-level time-to-lease becomes directionally useless.
Resident Retention Rate
Resident retention rate is the percentage of residents who renew their lease at expiration rather than moving out. Retention is cheaper than turnover — every operator knows this. Fewer operators measure it accurately.
The real retention metric is not the binary renew-or-leave number. It is retention segmented by lease term, unit type, and tenure. A resident who has been in place for three years and renews at a 5% increase is a very different signal than a first-year resident who renews at flat rent.
Data source: PMS lease records (lease start, expiration, renewal, and move-out dates).
Retention data is usually clean within a single PMS. The problem is aggregating it across platforms and comparing it against the concessions you offered to get those renewals. Without that context, a high retention rate might be masking a rent-growth problem.
The Three Property Management KPIs Most Operators Miss
These are not obscure metrics. Most operators know they matter. The issue is that tracking them accurately requires data that does not live in one place — and often does not exist in a structured format at all.
Revenue Per Available Unit (RevPAU)
Revenue Per Available Unit (RevPAU) is a metric borrowed from hospitality and adapted for multifamily. RevPAU combines occupancy, rental income, and ancillary revenue (parking, pet fees, storage, amenity fees) into a single number that reflects how well you are monetizing your physical asset.
RevPAU = Total Revenue / Total Available Units
RevPAU is more useful than occupancy or effective rent alone because it captures the full revenue picture. A property at 93% occupancy with strong ancillary revenue can outperform a property at 97% occupancy that leaves money on the table.
Why most operators cannot track it: Ancillary revenue is often tracked in the accounting system but not tied to individual units or unit types in the PMS. Parking revenue might be a line item in the general ledger with no connection to which units those tenants occupy. Pet fees might be tracked in a separate spreadsheet. Pulling all of these into a single per-unit calculation requires data normalization that most property management reporting setups do not support.
What it requires: A unified data layer that maps revenue streams from both the PMS and the accounting system to individual units. Not a manual spreadsheet. An automated pipeline that updates as transactions post.
Lease Conversion Efficiency
Lease conversion efficiency is the ratio of signed leases to total qualified leads or tours. Not just leads — qualified leads. And not just applications — signed leases.
This metric tells you how effective your leasing operation is at converting demand into revenue. A property with high traffic but low conversion has a different problem than a property with low traffic and high conversion. They need different interventions. Without this metric, both properties look the same until occupancy drops.
Why most operators cannot track it: Lead and tour data lives in the CRM or lead management system — platforms such as Knock, Funnel Leasing, or RentCafe. Lease execution data lives in the PMS. Connecting the two requires matching prospects in the CRM to leases in the PMS — often across different identifiers with no shared key.
Many operators calculate a rough version of this metric by dividing total leases by total leads. That number is directionally useful but masks the conversion funnel. You need stage-by-stage visibility: inquiry to tour, tour to application, application to lease. Each stage requires a different data source.
What it requires: Integration between your CRM and PMS with identity resolution — matching the person in one system to the same person in the other. Plus consistent data entry standards across every site team.
Controllable Expense Ratio
Controllable expense ratio is total controllable operating expenses (payroll, maintenance, marketing, utilities where sub-metered, vendor contracts) divided by effective gross income. This is the metric that tells you whether your operational execution is improving or whether rising rents are covering up operational bloat.
NOI growth gets the attention. But NOI can grow while your operations get less efficient if rents are rising fast enough. The controllable expense ratio strips out capital expenditures and fixed costs to show you how well you are managing the things you can actually manage.
Why most operators cannot track it: Controllable versus non-controllable expense classification requires a standardized chart of accounts across every entity and property. After an acquisition, the acquired portfolio often runs on a different chart of accounts. Reconciling them is a months-long accounting project. Until it is done, portfolio-level controllable expense ratios are unreliable.
What it requires: A normalized chart of accounts across all entities, mapped at a granular enough level to separate controllable from non-controllable expenses. Plus automated data feeds from every accounting system in the portfolio.
The Infrastructure Problem Behind Property Management KPIs
A pattern runs through every KPI on this list. The metric itself is not complicated. The math is straightforward. The difficulty is getting clean, timely, normalized data from systems that were never designed to talk to each other.
Most operators solve this with spreadsheets and analyst headcount. A reporting analyst pulls data from three PMS platforms, normalizes it in Excel, and produces a weekly report. That works until it does not — until the analyst leaves, or the portfolio grows, or the board wants daily data instead of weekly.
The operators who track all eight of these property management KPIs in real time have invested in a data infrastructure layer that sits between their source systems and their reporting tools. That layer handles normalization, identity resolution, and automated updates. It turns fragmented PMS data into a single source of truth that feeds a reliable property management dashboard.
That infrastructure is not optional if you want to compete on operational execution. It is the difference between managing by intuition and managing by signal.
What to Do Next
If you are tracking the first five property management KPIs and getting useful answers, you are in good shape. The next step is honest assessment: can your current data infrastructure support the other three?
If the answer is no, the fix is not a better dashboard. It is a better data layer. Start by auditing where each data point lives, how often it updates, and what it takes to normalize it across your portfolio. That audit will tell you exactly where the gaps are and what it will cost to close them.
The KPIs themselves are not the hard part. Getting the data right is.